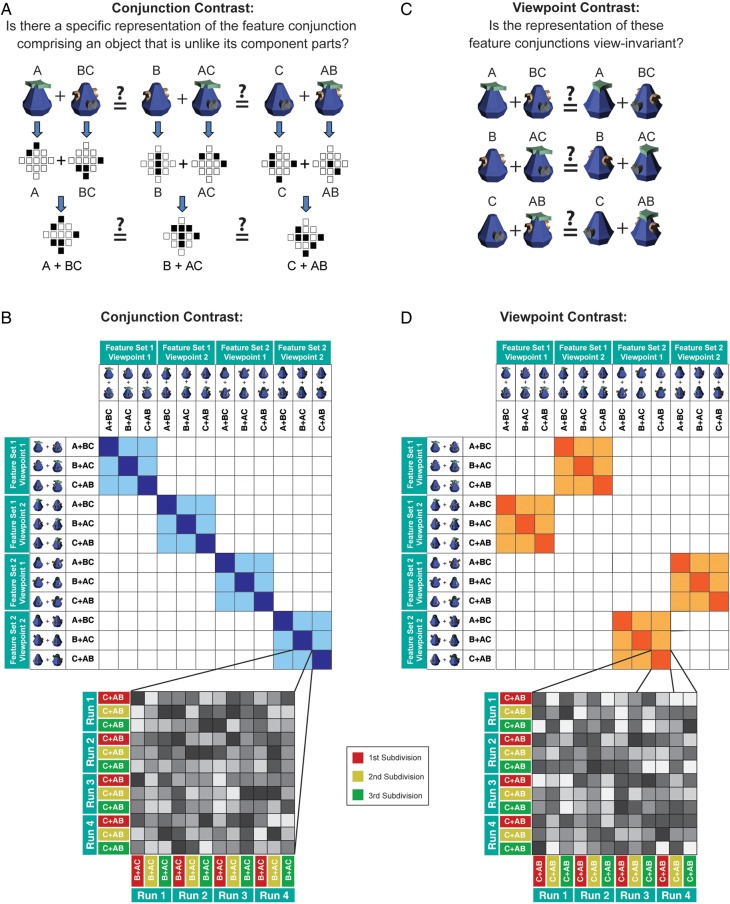
Figure 2.
Experimental questions and similarity contrast matrices. (A) Our first contrast investigated whether neural patterns of activity demonstrated explicit conjunctive coding (i.e., was the whole different from the sum of its parts?). To this end, we measured patterns of activity (schematized by a hypothetical region of interest consisting of 13 voxels) to each of the objects that were presented individually during the 1-back task. We then computed linear summations of these patterns for 3 different pairs of objects (i.e., A + BC, B + AC, and C + AB), which were matched terms of their individual features (A–C), but different in terms of their conjunction (i.e., AB, BC, AC). (B) MVPA correlations within and between these conjunctions were summarized in a matrix structure (the full 144 × 144 matrix is shown in Supplementary Fig. 2). This contrast tested whether correlations of repetitions of the same conjunctions (dark blue) were more similar in their activation pattern compared with correlations of different conjunctions (light blue). As shown by the zoomed-in cell, each cell in the conjunction contrast is in fact an average of a 12 × 12 correlation matrix that computed correlations across the 4 experimental runs and the 3 data subdivisions. (C) Our second contrast investigated whether the conjunctive representations were view-invariant. As with the conjunction contrast (A), we measured the patterns of activity evoked by individually presented objects and computed linear summations of these patterns for each object pair. We then tested whether these patterns of activity were sensitive to the viewpoint at which the conjunction was presented. (D) MVPA correlations within and across the same conjunctions shown from different viewpoints were summarized in a matrix structure. This contrast tested whether correlations of repetitions of the same conjunctions presented from different viewpoints (dark orange) were more similar in their activation pattern compared with correlations between different conjunctions presented from different viewpoints (light orange). Note that the gray cells in the zoomed-in depiction reflect hypothetical data for illustrative purposes only.

