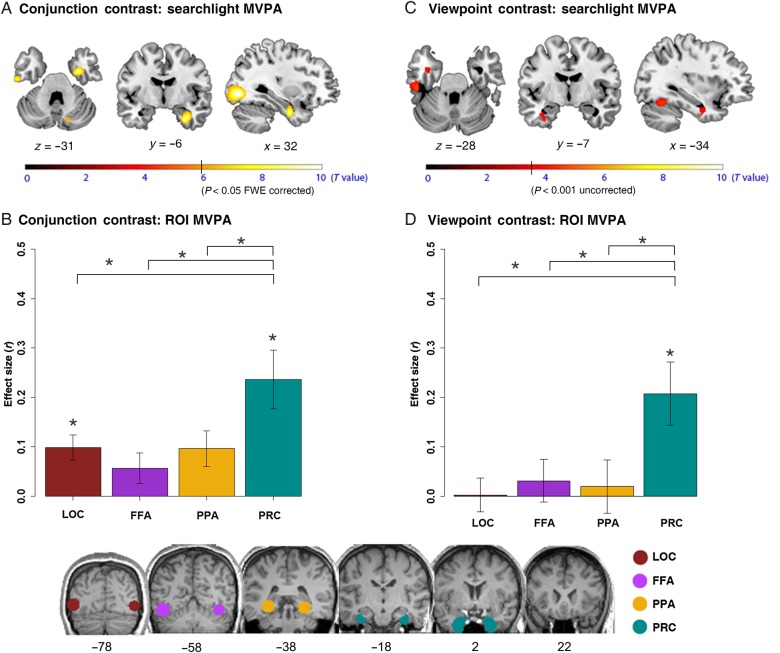
Figure 4.
Regions demonstrating explicit conjunctive coding within and across viewpoints. (A) Regions where the representation for the conjunction was different from the sum of its parts (P < 0.05, whole-brain FWE-corrected; results at P < 0.001, uncorrected shown in Supplementary Fig. 5). Broadly speaking, these regions included the PRC and earlier VVS regions (with the local maxima in V4). (B) The strength of conjunctive coding in the LOC, FFA, PPA, and PRC ROIs (shown at bottom are ROIs from a representative participant superimposed on that individual's structural scan). (C) Regions demonstrating view-invariant conjunctive representations (P < 0.001, uncorrected; no VVS regions survived whole-brain FWE correction). Broadly speaking, these regions included the PRC, as well as V4 and lateral IT cortex. (D) The strength of view-invariant conjunctive coding within and across ROIs. Error bars indicate SEM; *P < 0.05 for comparisons across ROIs (paired-samples t-tests indicated by brackets) and comparisons relative to zero within an ROI (one-sample t-tests indicated by an asterisk above a bar).

