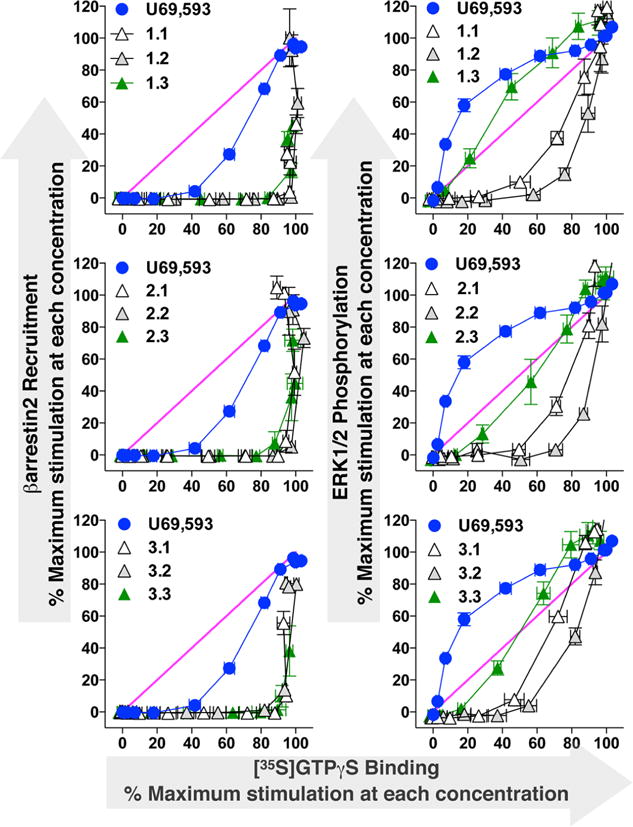
Figure 3.

Comparison of G protein signaling to βarrestin2 recruitment and ERK1/2 activation as a function of efficacy at each dose tested. Data are presented as the maximal stimulation at each agonist concentration normalized to U69,593. These equimolar plots present the comparison of each test agonist’s response profile to the stimulation produced by the reference agonist, U69,593. For comparison, each graph also presents an equimolar relationship of unity, slope equal to one. Each test agonist produces stimulation of G protein coupling before measurable βarr2 recruitment is observed. Conversely, the ERK phosphorylation produced by the test agonists is ligand dependent and some analogues approach both the reference agonist and the unity line.
