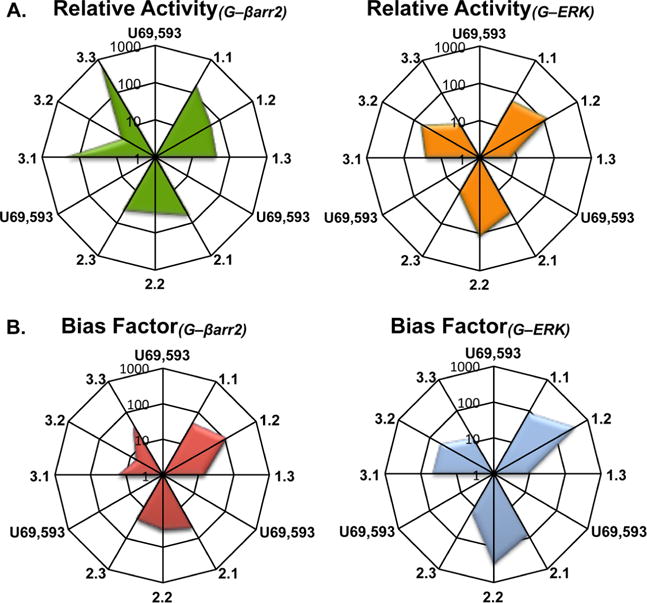
Figure 4.

Bias factors (ΔΔLogR values) and relative activity ratios represented. (A) Relative activity of each test agonist (Emax/EC50) is presented relative to the reference agonist U69,593. (B) Bias factors were calculated using the operational model and are presented as the degree of bias toward G protein coupling and away from βarr2 recruitment and toward G protein coupling and away from ERK 1/2 phosphorylation relative to U69,593. The center of each figure presents a value equal to one (as defined by the reference agonist). The bias factor of the reference agonist is equal to one and the values greater than one indicate bias toward G protein coupling compared to βarr2 recruitment or ERK phosphorylation. Values can be found summarized in Table 2.
