
Figure 5.
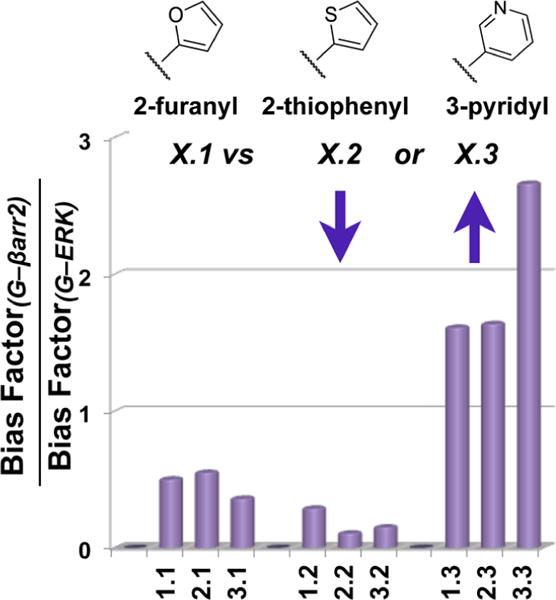
Schematic summarizing the SAR trends revealed when comparing the ratio of Bias Factors for each assay. Ratios were generated by dividing the bias factors for G protein vs βarr2 by the bias factors for G vs ERK1/2 activation from Table 2. A trend can be seen wherein the thiophenyl substitution increases the bias between G protein and ERK activation (denominator) resulting in a decrease in the ratio. The pyridyl substitution decreases the bias for G protein vs ERK activation (denominator) producing an increase in the ratio.