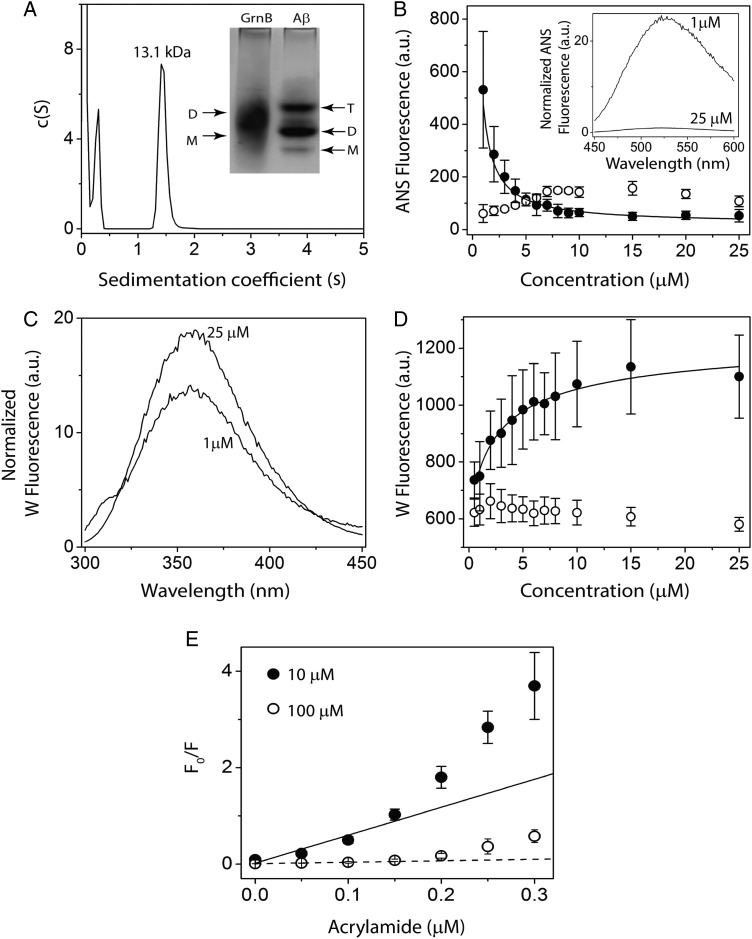
Fig. 5.
Dimerization of rGrnB. (A) Molecular size distribution of rGrnB at 100 μM obtained by sedimentation velocity indicates a predominant dimer (MW 13.1 kDa). (Inset) Native PAGE analysis of rGrnB at 100 μM run on a 14% gel indicates a diffuse dimeric band corresponding to ∼13 kDa, based on the Aβ sample electrophoresed in parallel for which monomer (M: 4.5 kDa), dimer (D: 9.0 kDa) and trimer (T: 13.5 kDa) are observed. (B, D) rGrnB (closed circle) concentration-dependent ANS binding and intrinsic tryptophan fluorescence, respectively. The normalized fluorescence was plotted against protein concentration, and data were fitted (solid line) to a monomer–dimer model as described in Supplementary data. Bovine serum albumin (BSA) (open circle) was used as a negative control. (Inset) (B) Representative normalized ANS fluorescence scans of 25 and 1 μM rGrnB. (C) Representative normalized tryptophan fluorescence scans of 25 and 1 μM rGrnB. E, Normalized Stern-Volmer plots for 10 μM (closed circle) and 100 μM (open circle) rGrnB using acrylamide as the quenching agent.

