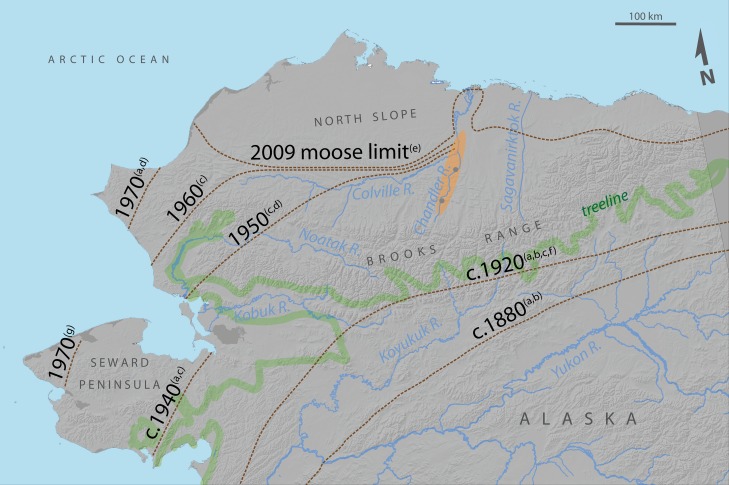
Fig 1. Changes in moose distribution (dashed lines) in northern Alaska since 1880 (exceptions listed in [6]).
Map is inset from Fig 3. Shrub plots were distributed along the Chandler and Colville Rivers (orange ellipse), and temperature records were derived at two locations therein (gray dots) [33]. a[16], b[24], c[6], d[27], e[30], f[26], g[31].

