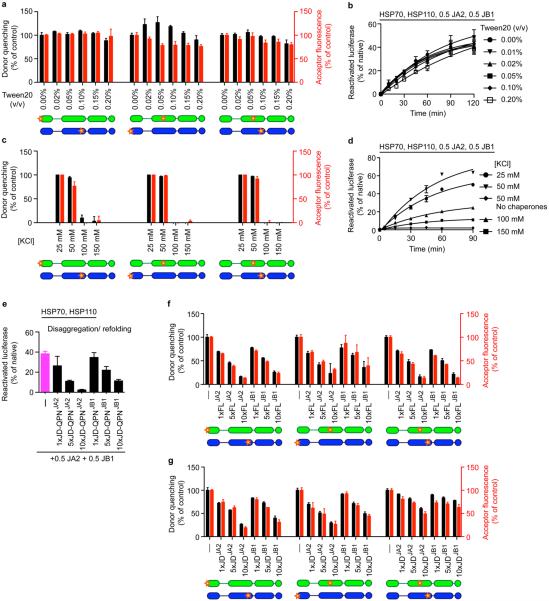
Extended data Figure 6. Electrostatic interactions between J-domain and CTD predominate in JA2 and JB1 complexes.
a, FRET efficiencies for JD–CTD and CTD–CTD interactions with 0–0.2% Tween20 titration. Percentage efficiency is relative to untreated (0% Tween20) samples. Donor quenching (black); acceptor fluorescence (red); below, fluorophore positions in J-protein protomers (JA2, green; JB1, blue). N-termini of JDJA2 and JDJB1 labelled with acceptor fluorophore ReAsH. CTDJA2 and CTDJB1 labelled with donor fluorophores FlAsH and Alexa Fluor 488 at residues 241 and 278, respectively. b, Disaggregation/refolding of preformed luciferase by JA2 and/or JB1 with increasing amounts of Tween20 (n = 2). c, FRET efficiencies for JA2 and JB1 interactions at increasing salt concentrations. d, Disaggregation/refolding of preformed luciferase aggregates by JA2 and JB1 with increasing salt concentrations; control, 50 mM salt, no chaperones (n = 2). e, Luciferase disaggregation/refolding in the presence of excess J-domain fragments carrying JD-QPNJA2/JB1 mutation of the HPD motif (n = 3). f, g, FRET between class A and B J-proteins. f, Competition with unlabelled full-length wild-type J-protein (FL); unlabelled competitor is 1–10× acceptor; (–), no competitor. g, Competition with unlabelled isolated JDJA2 and JDJB1. Data are mean ± s.e.m., average of at least two experiments for FRET experiments. Precise concentrations are shown in Extended Data Table 1.

