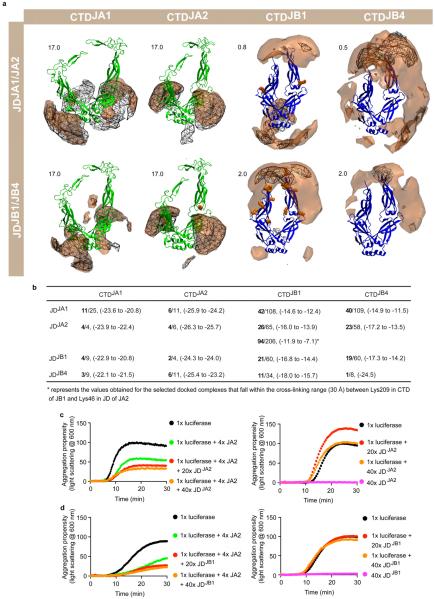
Extended data Figure 7. In silico prediction of JD–CTD interactions between class A and B J-proteins and in vitro evidence that physical interactions between J-proteins do not overlap J-protein substrate binding sites.
a, Preferred positions of the centres of geometry (CoG) of J-domains (y axis, JA1, JA2, JB1 and JB4) around CTD dimers (x axis, class A, green, class B, blue) obtained from molecular docking simulations. JDJA1/JB1, wireframe meshes; JDJA2/JB4, brown contours, each contoured at the isovalue given in the top left of each image. The higher scores for class A CTDs indicate greater specificity of the complexes formed with J-domains; the lower scores for class B CTDs indicate much less specific interactions. Lysines in inter- and intra-J-protein JA2–JB1 cross-links, orange spheres. b, Properties of the docking arrangements obtained after clustering. Total number of clusters per simulation, denominator; number of selected clusters (corresponding to 90% of all docked complexes), numerator, bold. In parentheses, the range of average energy values (in units of kT) for the selected clusters. Lower energy values indicate more favourable binding; fewer clusters indicate a more defined binding mode (see Methods). JDJA2 docking to CTDJB1 is much weaker and less specific than JDJB1 docking to CTDJA1, but docking arrangements compatible with cross-linking results still obtain (Fig. 2d). c, Competition of isolated JDJA2 fragments against JA2 holdase function in luciferase aggregation at 42 °C (n = 2). d, Competition of isolated JDJB1 fragments against JA2 holdase function (n = 2). Luciferase, 1×; JA2, 4×; isolated J-domain fragments, 20× (red; 5-fold excess over JA2), or 40× (orange; 10-fold excess over JA2). Light scattering measured at 600 nm. Precise concentrations are shown in Extended Data Table 1.

