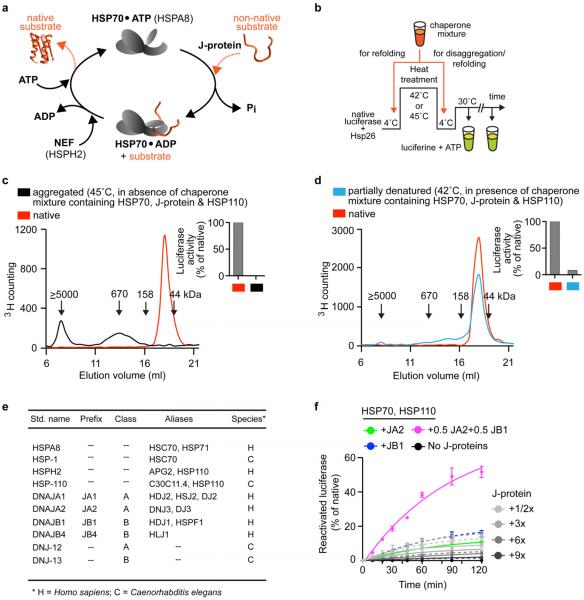
Extended data Figure 1. Characterization of protein disaggregation/refolding and refolding-only reactions.
a, HSP70–J-protein–HSP110 (HSPA8–J-protein–HSPH2) functional cycle. Concomitant interaction of HSP70 with a J-protein and substrate results in allosteric stimulation of ATP hydrolysis; this traps the substrate in HSP70 (ref. 8). Subsequent NEF (for example, HSP110) promoted ADP dissociation from HSP70, then allows ATP rebinding, which triggers substrate release to complete the cycle54,55. b, Scheme for in vitro disaggregation/refolding and refolding-only reactions. The aggregates used in disaggregation/refolding assays are preformed by heating luciferase with yeast small heat-shock protein (sHSP) Hsp26 (ref. 4), which is known to co-aggregate with misfolded proteins in vivo27,28 (see Methods for detailed description). If HSP70, J-protein and HSP110 are instead heated together with substrate and Hsp26, luciferase is denatured into a more easily refoldable, inactive and largely monomeric substrate form used in refolding-only assays. c, SEC profiles of aggregated 3H-labelled luciferase (black; size range 200 kDa to ≥5,000 kDa representing ~2 to >50 aggregated luciferase molecules) and monomeric native luciferase (red; size ~63 kDa). Arrows indicate elution size (kDa). Inset, activity of loaded material. d, SEC profile of partially denatured and largely monomeric luciferase (starting material for refolding-only reactions). Inset, activity of loaded material. e, Chaperone nomenclature. f, Disaggregation and reactivation of preformed luciferase aggregates using human HSP70–HSP110 with human J-proteins JA2, green; JB1, blue; JA2+JB1, magenta or no J-protein, black. Under limiting chaperone (HSP70/HSP110) and increasing J-protein concentrations (A, solid or B, dashed) (n = 3). Data are mean ± s.e.m. Precise concentrations are shown in Extended Data Table 1.

