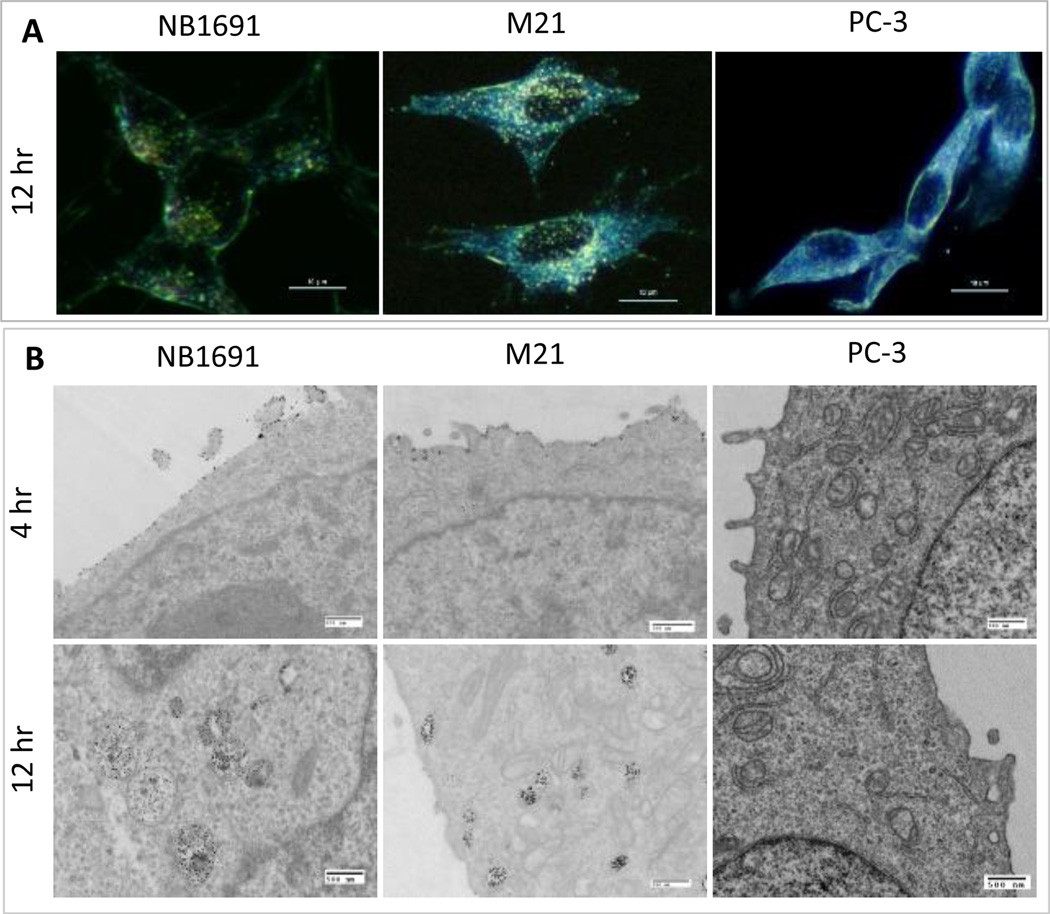
Fig. 2.
GD2-dependent cell binding and internalization of HGNPs. A) Dark field images of NB1691, M21, PC-3 cells after incubation with HGNPs at 5 nM for 12 hr. The scale bar represents 10 µm. B) TEM images of NB1691, M21, PC-3 cells after incubation with HGNPs at 5 nM for 4 hr and 12 hr. The scale bar represents 500 nm.

