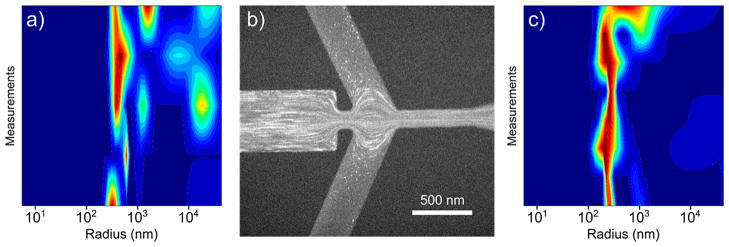
Figure 4.
PSI crystal sorting in the optimized design (VI: +50 V, VS: −150 V, VC: −100 V). (a) DLS signal heat map illustrating the broad size distribution (~200 nm to ~20 μm) of a bulk PSI crystal suspension. (b) Fluorescence microscopy image of PSI crystals being sorted in the device where large crystals are focusing and small crystals deflect into “S”. (c) DLS signal heat map of the “S” fraction showing a submicrometer size distribution is isolated from the bulk.

