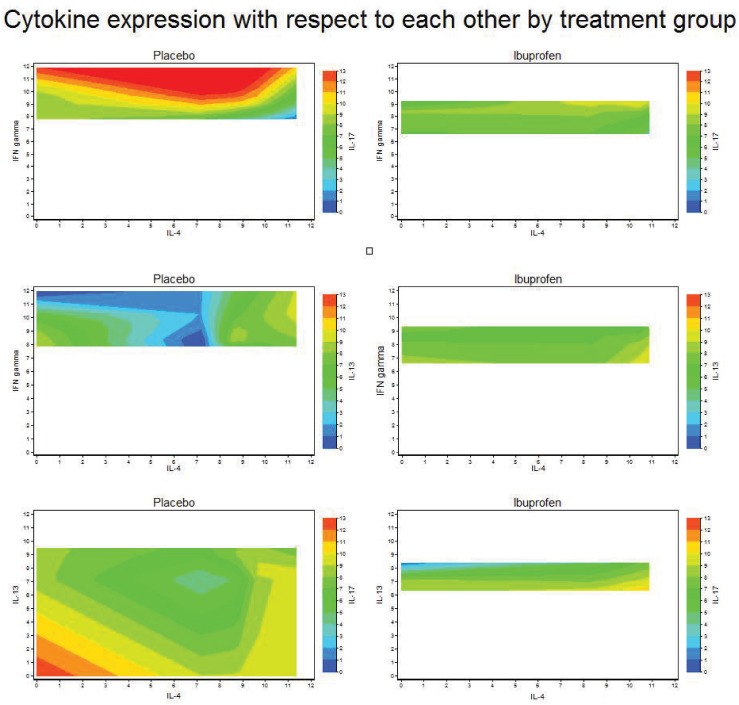
Fig 4. Comparison of the expression of each cytokine (as measured by polymerase chain reaction of the genes required for their production) with respect to the expression of other cytokines in mediastinal lymph node in ibuprofen and placebo groups.
Warmer colors (yellows, reds) on the Z-axis indicate higher levels, cooler color (greens, blues) indicate lower levels.

