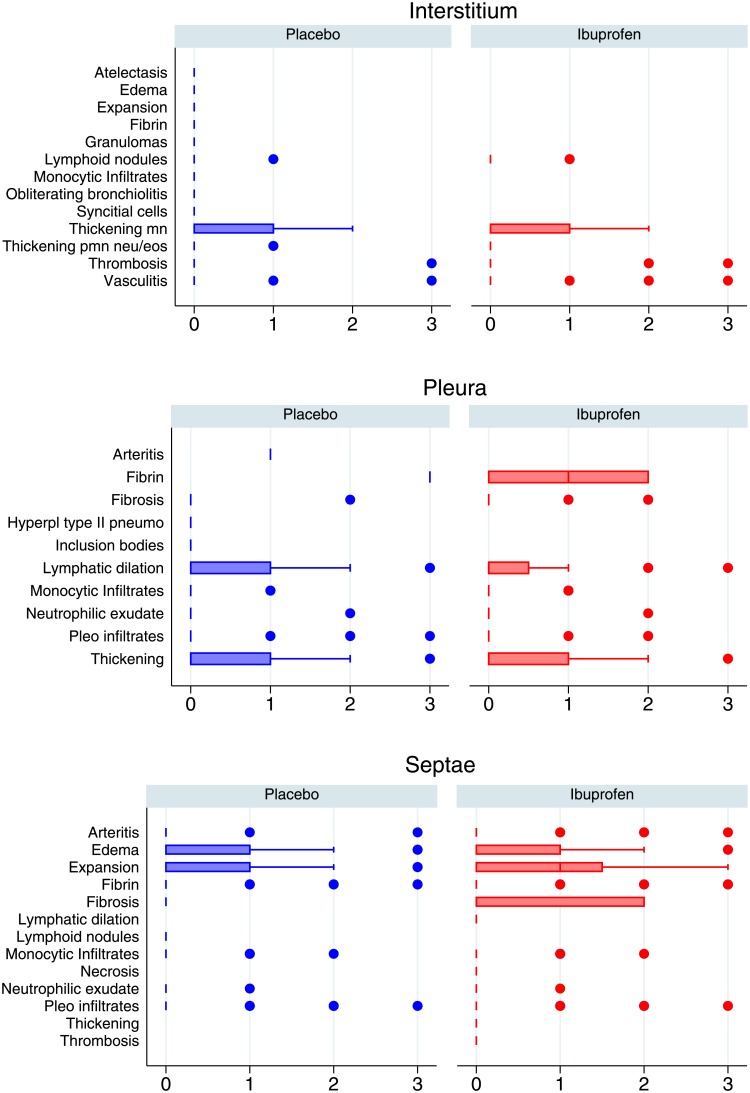
Fig 6. Comparison of histology findings between placebo and ibuprofen treated calves broken down by anatomical levels as follows: interstitium, septae, and pleura.
These are scored 0 (absent), 1 (mild), 2 (moderate) 3 (severe). The median is indicated by a line and the interquartile range by the box. Whiskers encompass data 1.5 times the IQR of the upper and lower quartiles. Outlying data is indicated with points. Ibuprofen is in red, placebo in blue. EOS; eosinophils, Hyperpl; hyperplastic, MN; monocytes, PMN; neutrophils, Pneumo; pneumocytes.

