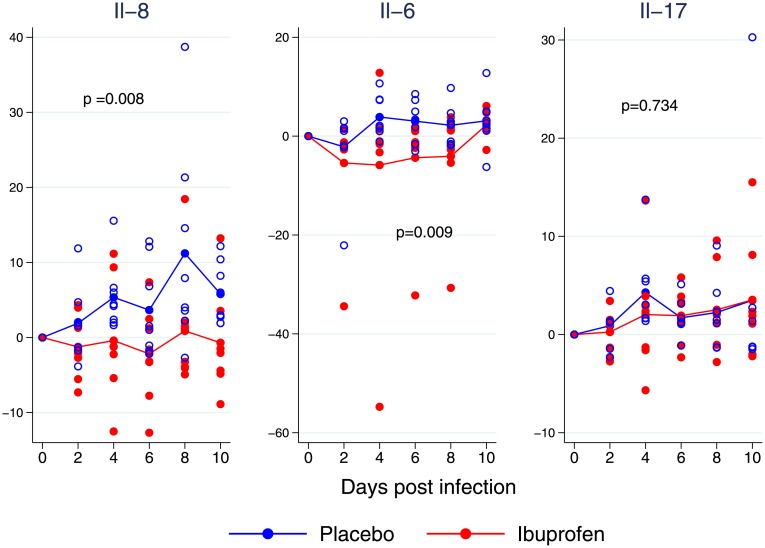
Fig 8. Mean by treatment group cytokine expression (samples collected by nasal swabbing).
Statistical significance was calculated using a mixed effects mode. Ibuprofen is red, placebo group blue. IL-8 was significantly different between groups. IL-6 demonstrated substantial variance and return to similar levels between treatment groups over the duration of the experiment. This difference was statistically significant only at the time of peak difference (p = 0.009). Il-17 was not different between groups at any time during the experiment.

