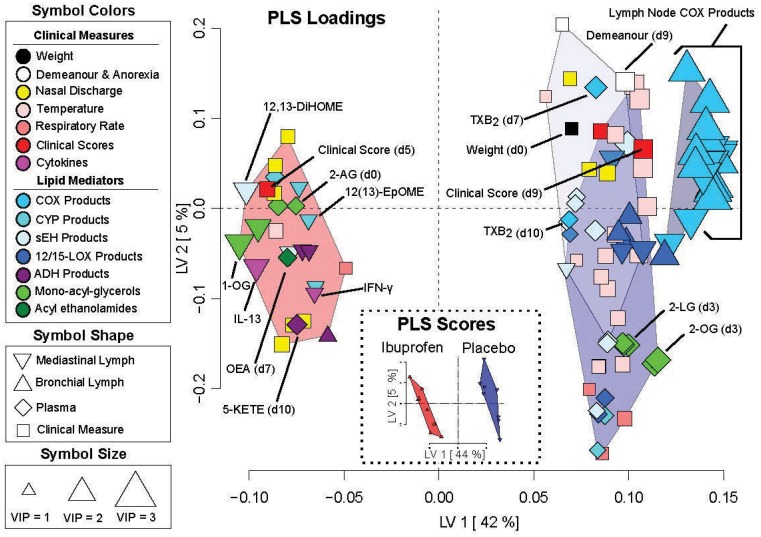
Fig 10. Partial least squares discriminant analysis (PLS-DA) of measurement from RSV infected calves with and without ibuprofen treatment.
The Scores Plot (Inset) shows treatment group discrimination (ibuprofen: red; placebo: blue). The Loadings Plot shows the discriminant variable weighting with variables grouped by hierarchical cluster analysis of their Spearman’s correlations. Point shapes describe variable origin (i.e. tissue type or clinical observation), point colors describe variable class (i.e. metabolite or clinical data type) as described in the figure, and point sizes are defined by the variable importance in projection (VIP) scores. VIP scores roughly correlate with t-test p-values (small p = 0.12–0.05, medium p<0.05, large p<0.001). Variables to the right of the origin are elevated in the placebo group. For example, the placebo group shows higher lymph (triangles) and plasma (diamonds) concentrations of cyclooxygenase (COX) and lipoxygenase (LOX) products, higher plasma thromboxane B2 (TXB2), higher temperatures and plasma concentrations of soluble epoxide hydrolase (sEH) generated fatty acid diols at the majority of time points, but lower concentrations of fatty acid alcohol dehydrogenase (ADH) metabolites in lymph tissues and plasma.

