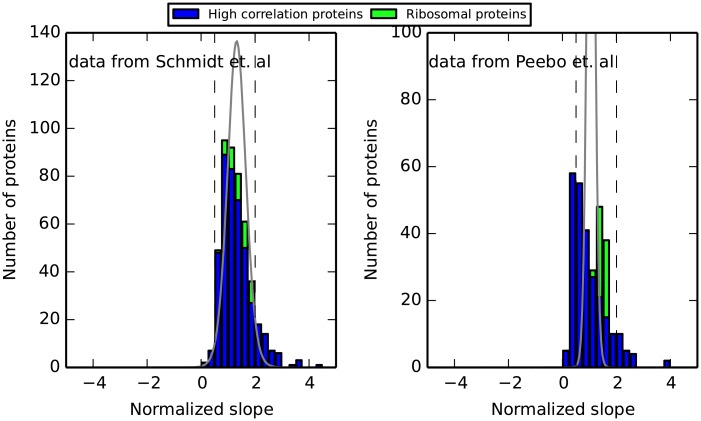
Fig 3. Histogram of the slopes of regression lines for the highly correlated with growth proteins (473 and 305 proteins in the left and right panels respectively).
Ribosomal proteins are stacked in green on top of the non ribosomal proteins, marked in blue. Proteins fractions were normalized to account for differences in slopes resulting from differing average fractions (Methods). The expected distribution of slopes given the individual deviations of every protein from a linear regression line, assuming all proteins are coordinated, is plotted in gray. Dashed vertical lines at 0.5 and 2 represent the range at which the slopes of of the proteins lie. Left panel—data from [29], right panel—data from [13]. High correlation proteins share similar normalized slopes, implying they are coordinated, maintaining their relative ratios across conditions (see text for further details). Ribosomal proteins, shown in green, scale with growth rate in a manner similar to the rest of the high correlation proteins (see text and S7 Fig).

