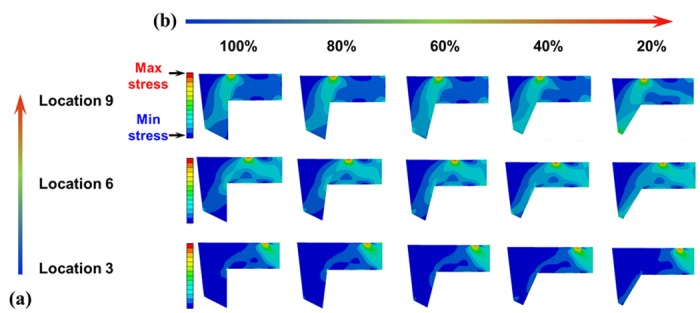
Fig 3. L-strut stress distribution.

Red and blue indicate the highest and lowest stresses, respectively. Relatively high stress occurred at point 1 (applied load), point 2 (L-strut inner corner), and point 3 (contact between maxillary bone and the L-strut). Increased stress on the L-strut occurred as the location of the applied load moved caudally (supratip breakpoint) and the contact percentage decreased. A. Stress distribution according to the location of the applied load. As the applied load increased near the supratip breakpoint, the stress value increased at point 2 and around point 2. B. The stress distribution according to the contact percentage between the L-strut and the maxillary crest. Increased stress occurred in the caudal segment between points 2 and 3 as the contact percentage decreased.
