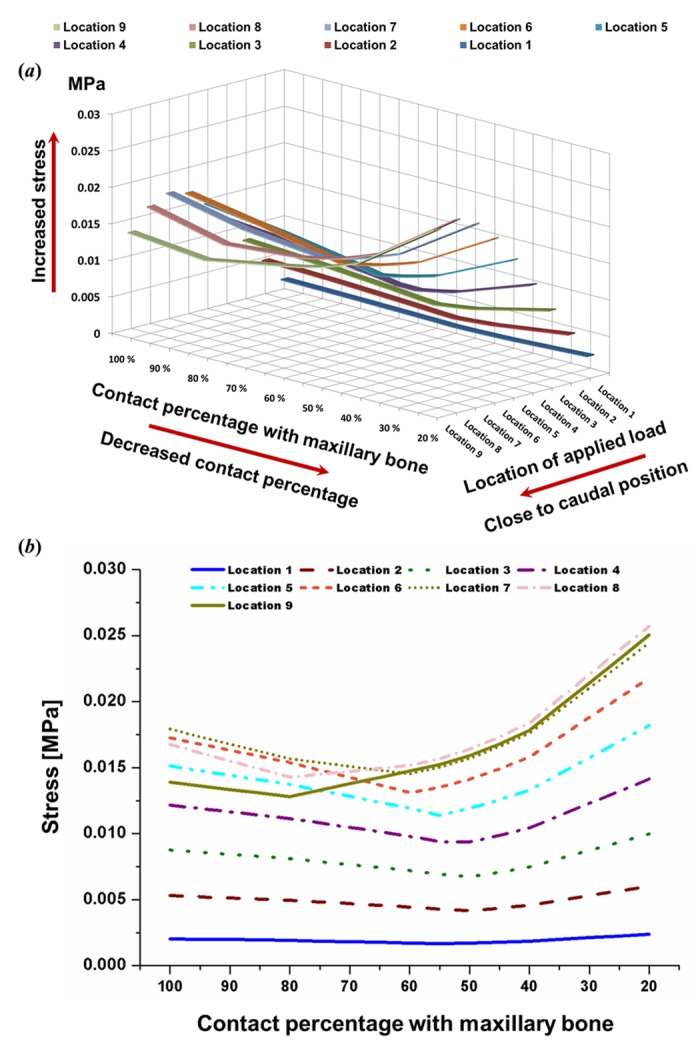
Fig 5. Maximum stress values between stress applied at points 2 and 3 according to the location of the applied load and the contact percentage with the maxillary bone.

A. Three-dimensional graph. B. Two-dimensional graph. Stress values increased gradually as the applied load moved closer to the caudal position. The larger stress values at points 2 and 3 occurred under the location 6–9 load conditions. Stress on the L-strut was dependent on the contact percentage. Stress increased steadily at the later transition point and increased rapidly with contact percentages of 45–20%. Stress values, particularly those under the location 6–9 load conditions, increased rapidly in the 45–20% contact range. Moreover, the maximal L-strut stress values at points 2 and 3 were 2.5-fold larger than that of the applied load.
