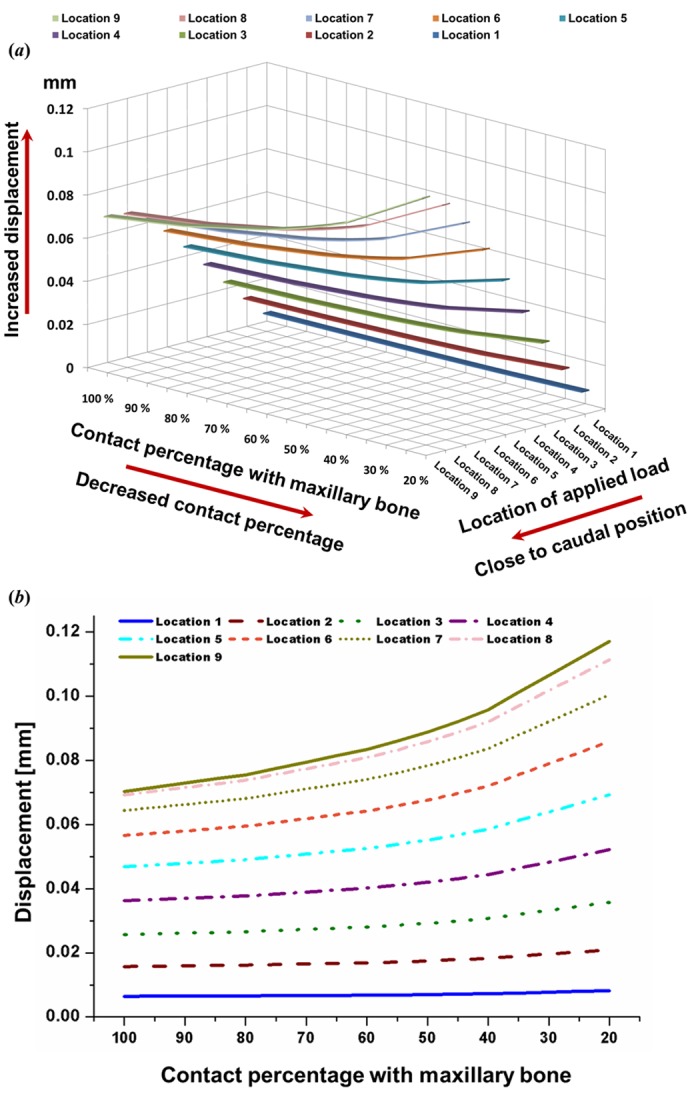
Fig 7. Displacement at point 2.

A. Displacement values at point 2 rose steadily under the caudal load condition; maximum displacement occurred under the location 8 and 9 load conditions. B. Displacement increased as contact percentage decreased, showing rapid displacement in the 45–20% contact range.
