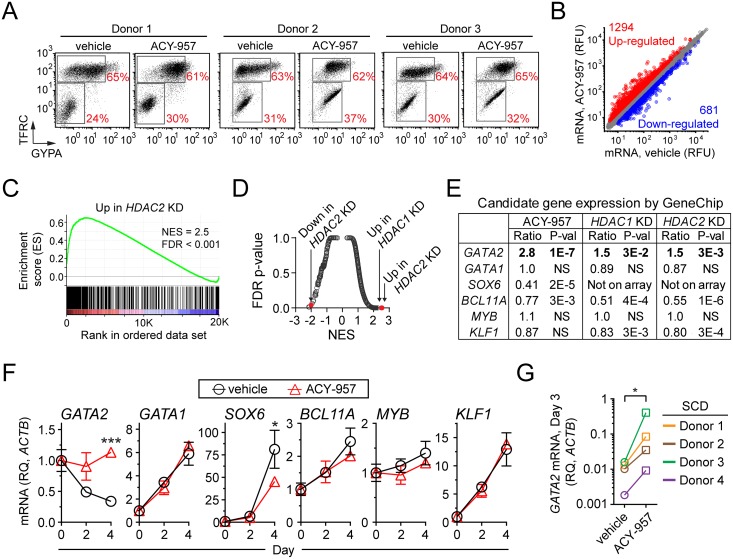
Fig 5. Effect of HDAC1/2 inhibition on gene expression in erythroid progenitors.
(A) Erythroid maturation stage of cells used in gene expression profiling experiments. BM cells were cultured in CS1 expansion media and then shifted to CS1 differentiation media for 5 days with vehicle or 1 μM ACY-957. At the end of the culture period, erythroid maturation stage was determined by flow cytometry and total RNA was isolated for analysis using Affymetrix GeneChips. Experiments were performed using cells from three independent donors. (B) Differentially expressed genes resulting from ACY-957 treatment using a filter of absolute fold change greater than 1.5 and a P-value less than 0.025. (C) Gene set enrichment analysis demonstrates that genes up-regulated by HDAC2 knockdown (‘Up in HDAC2 KD’ gene set) are significantly overrepresented at the top of a ranked list of gene expression changes resulting from ACY-957 treatment. Significant enrichment is illustrated by the positive running enrichment score (ES) marked by the green line, normalized enrichment score (NES) = 2.5, and false discovery rate (FDR) P-value < 0.001. (D) Enrichment scores of the ‘Up in HDAC1 KD’, ‘Up in HDAC2 KD’, and ‘Down in HDAC2 KD’ gene sets relative to all gene sets (2777 total) in the Molecular Signatures Database collection of Chemical and Genetic Perturbations. (E) GeneChip derived gene expression ratios of candidate HBG modulators following ACY-957 treatment, HDAC1 knockdown, or HDAC2 knockdown. Ratios expressed as treatment versus control. NS, not significant. (F) Gene expression of candidate HBG modulators by QPCR. BM cells were cultured in CS1 expansion media, and then shifted to CS1 differentiation media for 4 days in presence of vehicle or 1 μM ACY-957. Gene expression is shown relative to ACTB and normalized to day 0 (mean ± SD, n = 3 cell culture replicates). P-values were calculated for day 4 using a two-tailed t test. *P<0.05 and ***P<0.0005 compared to vehicle treatment. Data is representative of experiments using cells from two independent donors. (G) Induction of GATA2 mRNA by ACY-957 in cells from the four SCD donors described in Fig 3A. P-values were calculated using a two-tailed, paired t test. *P<0.05 compared to vehicle treatment.

