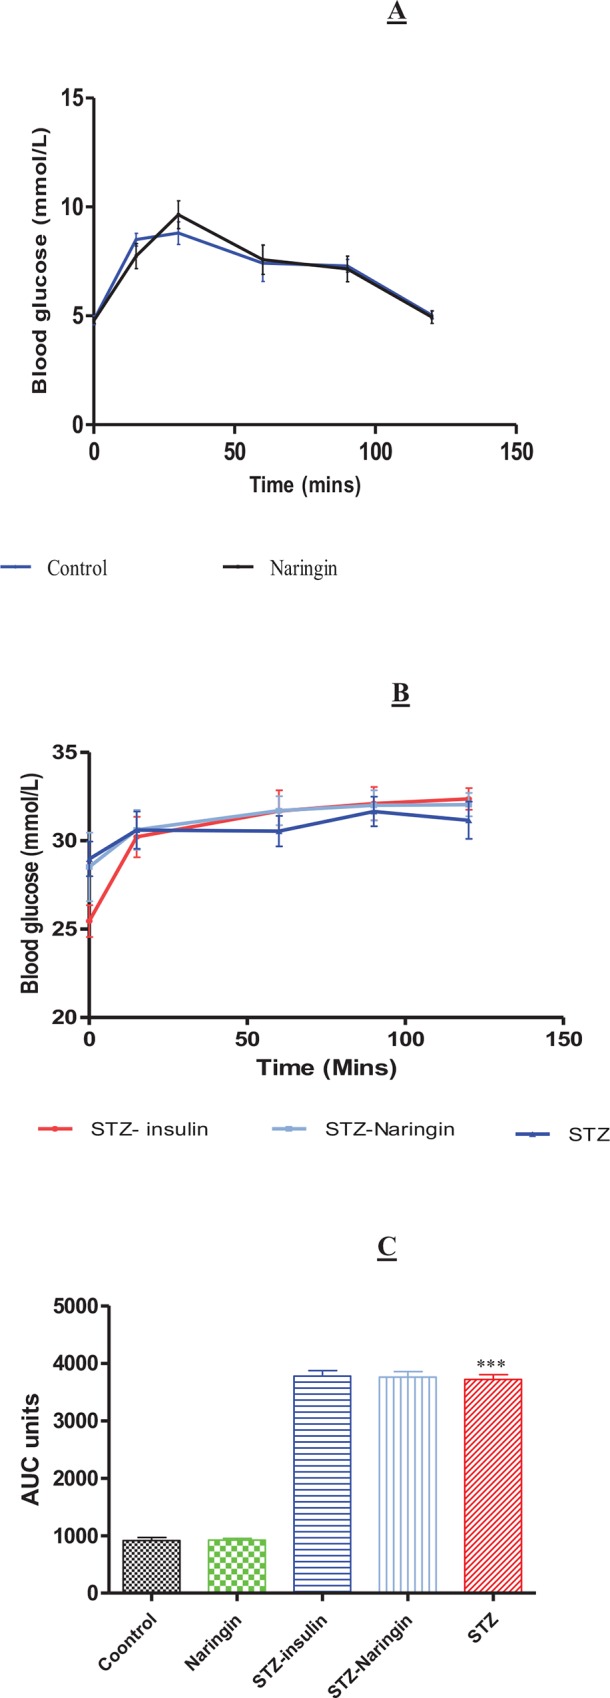
Fig 5.

Glucose Tolerance Tests (GTT) after the animals were fasted overnight and challenged with intreperitoneal injection of 3.0 g/kg BW of glucose in normal saline in normal animals treated with distilled water (controls) or naringin (A) and STZ-treated animals (B). Insulin treatment was withheld on the day of GTT and the figures were plotted in different graphs for clarity considering the large differences in blood glucose concentrations between normal and STZ groups on the y-axis. C; Calculated AUC from GTT. (***p<0.0001 compared to the normal control group).
