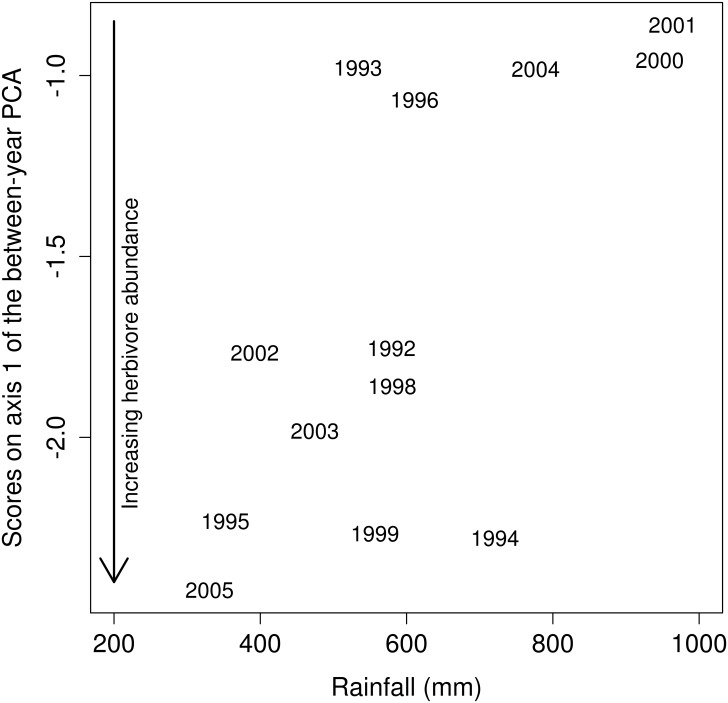
Fig 5. Effect of annual rainfall on herbivore abundance at waterholes.
Relationship between annual rainfall and component scores from the first axis of the between-year principal component analysis (Pearson r = 0.68, P = 0.01). This first axis represented 92.6% of the inter-annual variation in herbivore abundance at waterholes, and lower values indicated lower herbivore abundance.

