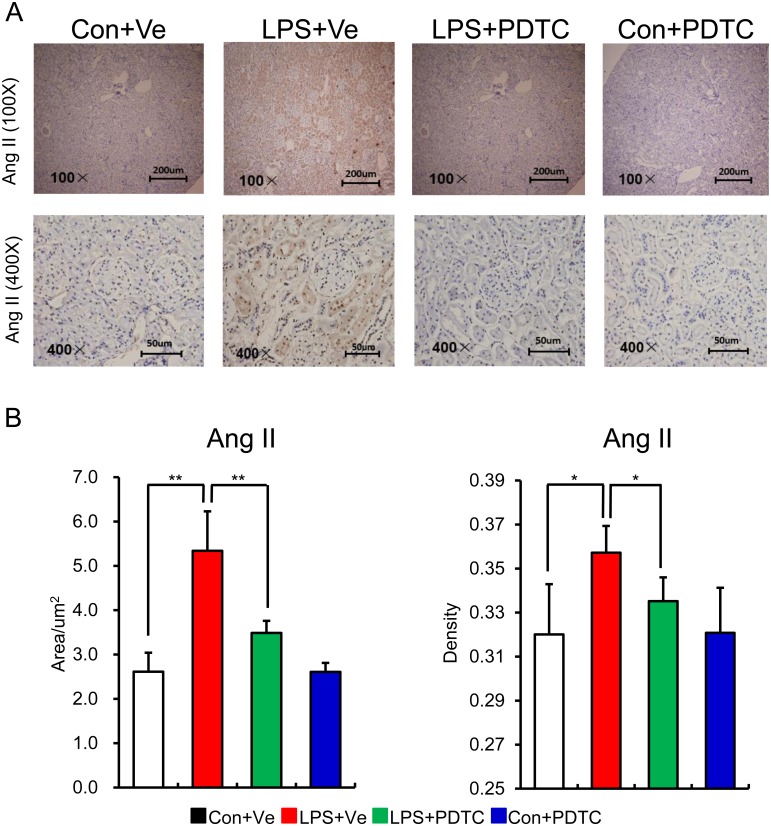
Fig 6. Higher level of Ang II positive cell in kidney in offspring of prenatal LPS exposure is reversed by post-natal NF-κB inhibition.
The protein expression of Ang II in renal tissue of offspring at the age of 20 weeks was determined by immunohistochemistry staining. Representative picture from each group (A) and semi-quantitation of its positive area and density (B) are shown. Data are shown as mean ± SD. n = 7 offspring and 4–5 pictures from each offspring were quantified for (B). * and ** indicate P<0.05 and P<0.01, respectively, which denote statistical comparison between the two marked treatment groups (Two-way ANOVA followed by LSD test (B) for inter-group comparison). Indications of Con+Ve, LPS+Ve, LPS+PDTC and Con+PDTC are as described in Fig 1.

