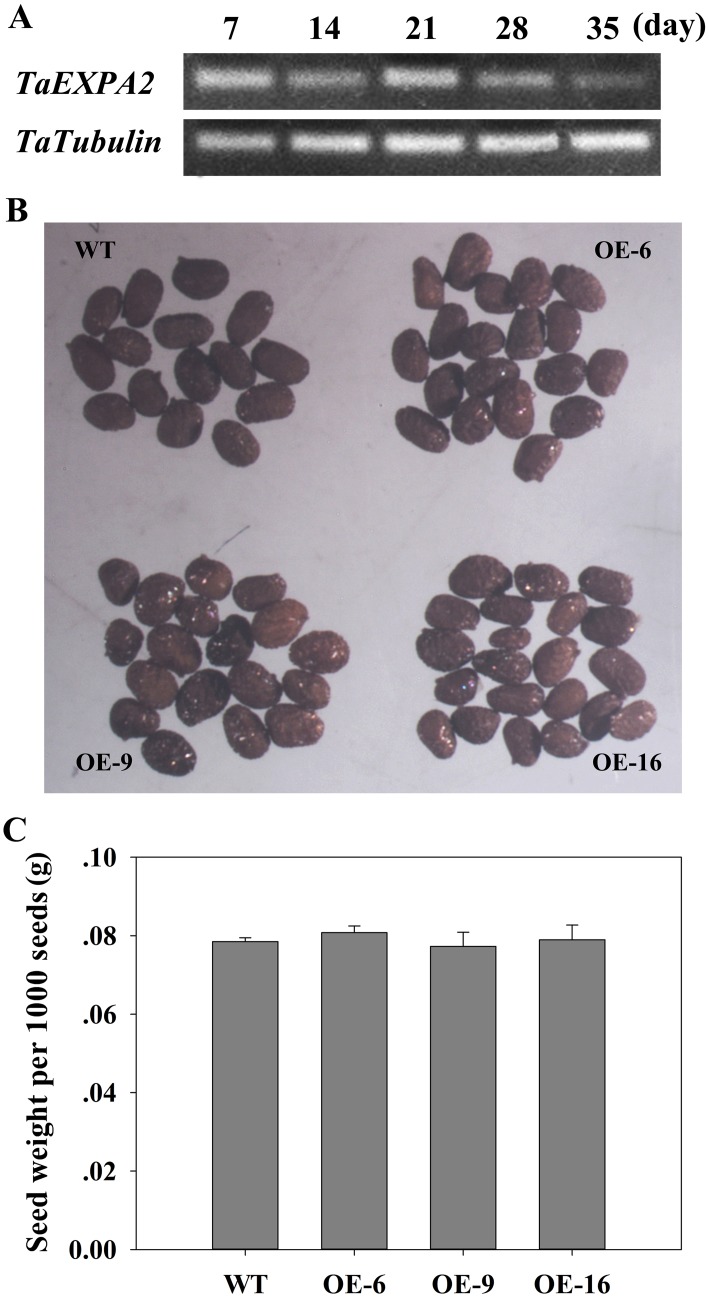
Fig 5. Seed size comparison and expression profile of TaEXPA2 during wheat-grain-filling in WT and transgenic plants.
(A) The level of TaEXPA2 expression during wheat-grain-filling by RT-PCR. The wheat grains were collected after pollination at intervals of 7 days to isolate total RNA. TaTubulin was used as an internal control. (B) Comparison of seed size in WT and TaEXPA2 transgenic tobacco plants. These images were obtained under the same magnification using a dissecting microscope (OLYMPUS SZX12). (C) Total weight of one thousand seeds. Data represent the mean values for the six independent biological replicates.

