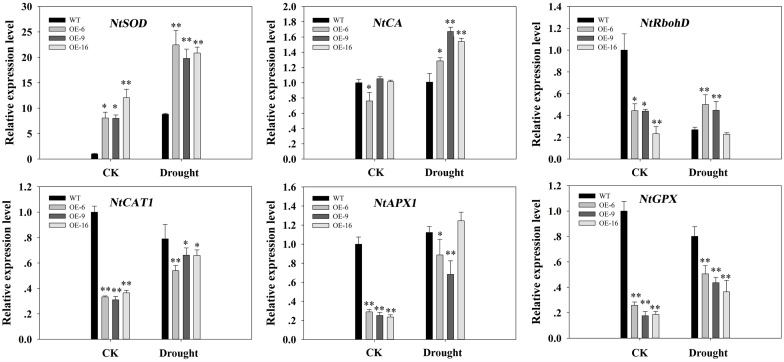
Fig 11. The expression of antioxidant-related genes in WT and transgenic tobacco plants under drought stress, as detected by qPCR.
The transcript levels of these genes in transgenic plants are indicated relative to the levels in WT plants (taken as 1), and using transcripts of actin in the same samples as a reference. Each column represents the mean ± standard error of three replicates. * and ** indicate significant differences from the WT values at P < 0.05 and P < 0.01, respectively, according to Duncan’s multiple range test.

