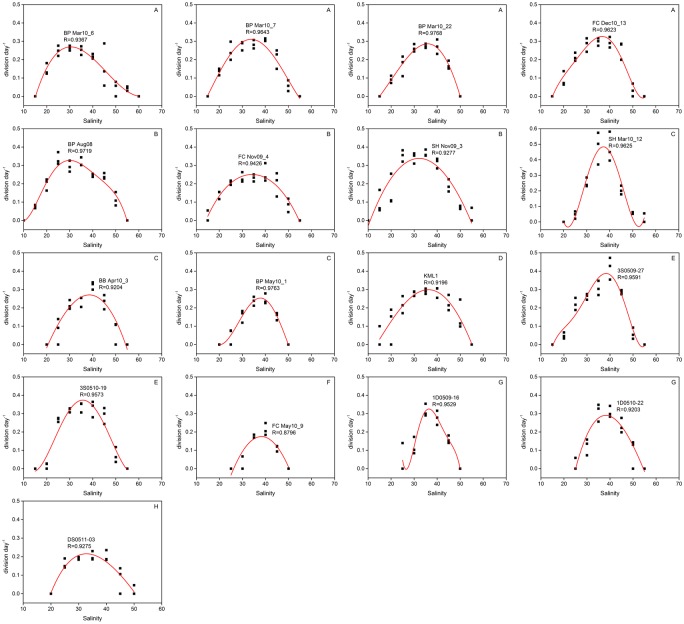
Fig 3. Gambierdiscus growth rate responses (black squares) to salinities of 10–60 and simulated growth curves (red line) by polynomial regressive analysis.
(A) G. belizeanus (BP Mar10_6, BP Mar10_7, BP Mar10_22, FC Dec10_13), (B) G. caribaeus (BP Aug08, FC Nov09_4, SH Nov09_3), (C) G. carolinianus (SH Mar10_12, BB Apr10_3, BP May10_1), (D) G. carpenteri (KML1), (E) G. pacificus (3S0509-27, 3S0510-19), (F) G. silvae (FC May10_9), (G) Gambierdiscus sp. type 4 (1D0509-16, 1D0510-22), and (H) Gambierdiscus sp. type 5 (DS0511-03).

