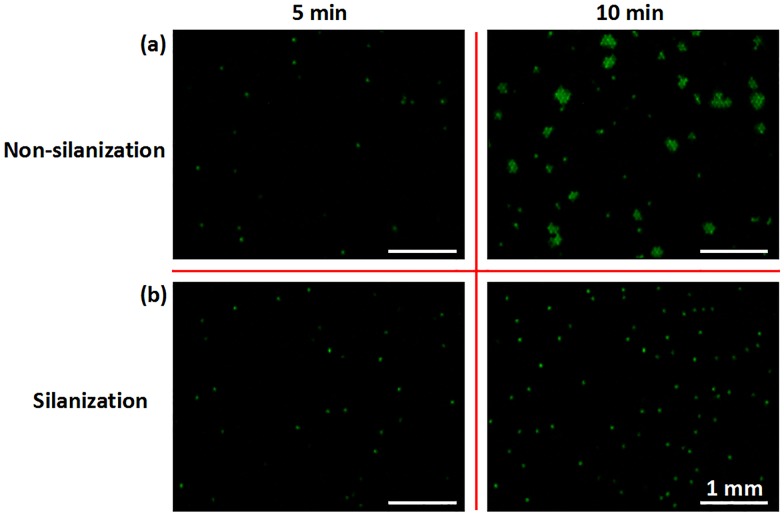
Fig 3. Digital RPA on the non-silanization and silanization chip.
Real-time images of RPA amplification at 5 min and 10 min are shown. For a gDNA sample concentration of 0.53 pg μL-1, there are 1.2 copies of gDNA per 100 wells, on average. Scale bar represents 1 mm. (a) Many clusters of positive RPA wells appeared gradually from 5 min to 10 min, with cross-contamination on the non-silanization chip. (b) Positive RPA wells amplified independently from 5 min to 10 min, without cross-contamination on the silanized chip.

