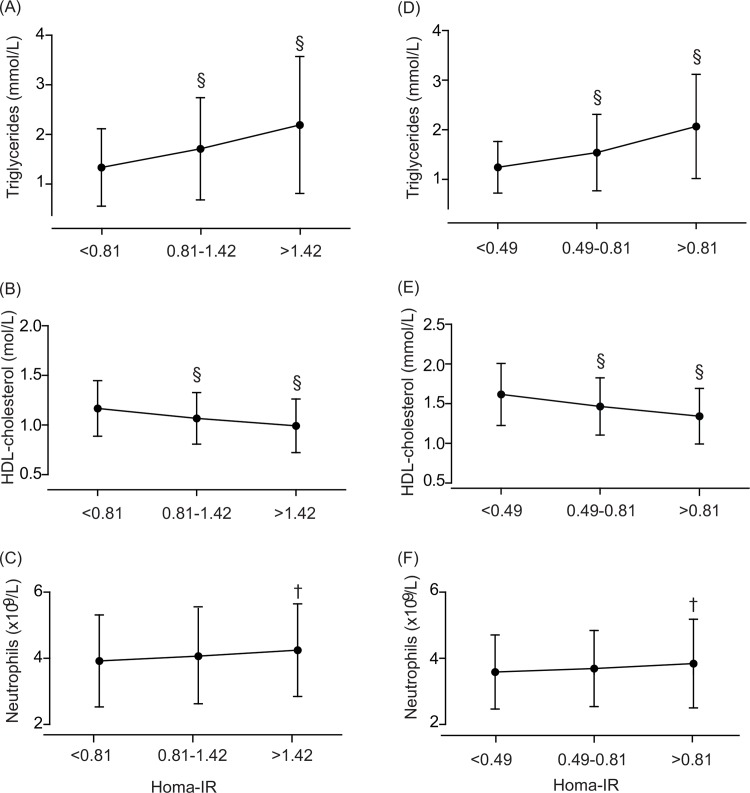
Fig 1.
Serum triglycerides (A, D), serum HDL-cholesterol (B, E) and neutrophil count (C, F) by thirds of the distribution of insulin resistance. Insulin resistance was computed by Homeostasis Model Assessment algorithm (HOMA-IR), using C peptide in diabetic Lu Hepatients (A, B, C) patients and insulin in non-diabetic FLEMENGHO participants (D, E, F). Significance of the difference with the adjacent lower third: ɫ p≤0.01; § p≤0.0001.

