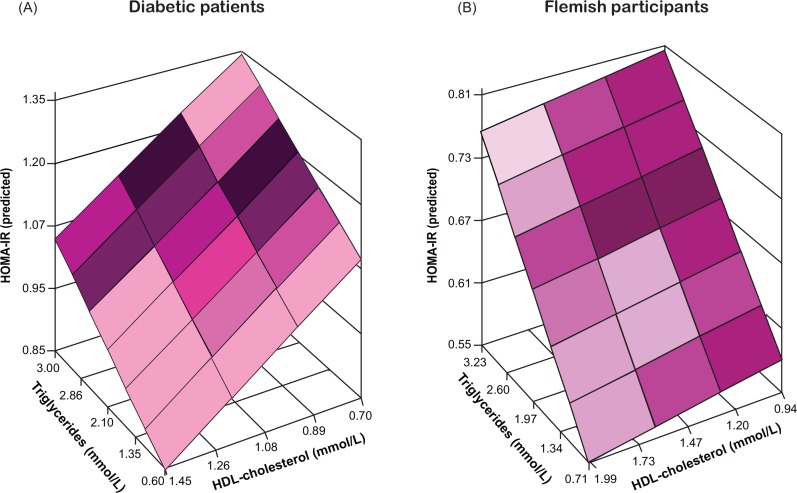
Fig 3. Insulin resistance as function of the serum levels of triglycerides and HDL-cholesterol and the neutrophil blood cell count.
Insulin resistance was computed by Homeostasis Model Assessment algorithm (HOMA-IR) and plotted along the vertical axis. Serum triglycerides and HDL-cholesterol are plotted along the horizontal axes. The colour gradient in the modelled two-dimensional plane represent the gradient of the neutrophil blood cell count. All estimates were standardised to the average in each population (mean or ratio) of age, body mass index, mean arterial pressure, and use of antidiabetic medications (by class), lipid-lowering drugs (by class), antihypertensive drugs (by class), and nonsteroidal anti-inflammatory drugs (see S3 Table).

