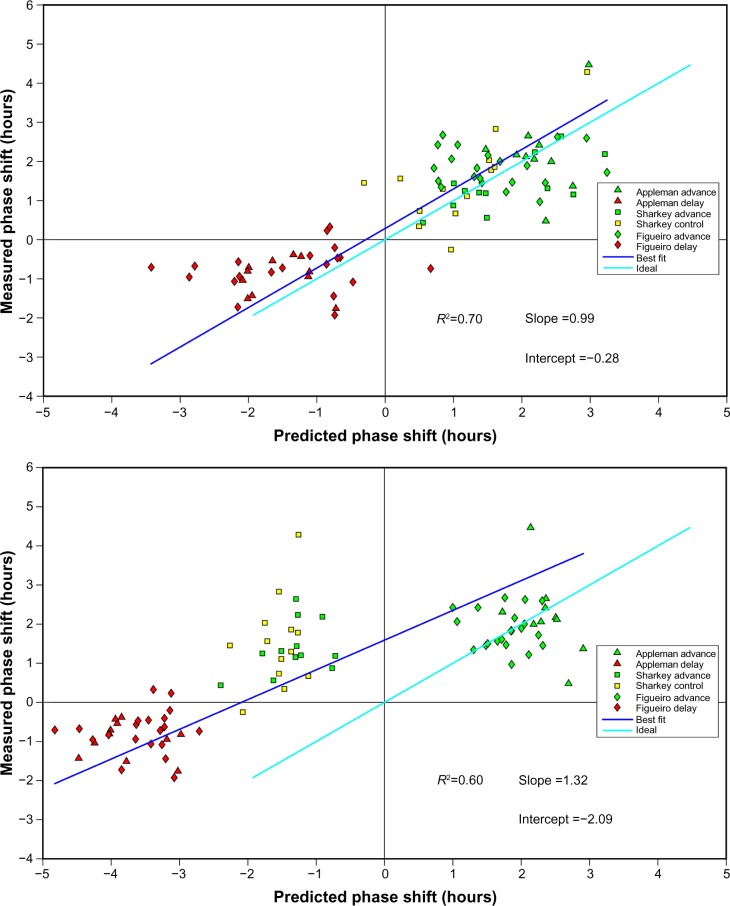
Figure 3.
Correlation between DLMO and the predicted phase changes calculated from the Daysimeter data and the modified Kronauer model.
Notes: (A) Measured changes in dim light melatonin onset (DLMO) from baseline to postintervention are plotted on the ordinate and circadian stimulus (CS)-oscillator model predictions based on actual measured light exposures during the intervention are plotted on the abscissa. (B) Measured changes in DLMO from baseline to postintervention are plotted on the ordinate and CS-oscillator model predictions based solely on the treatment light exposures (ie, not using light exposures measured throughout the day by the Daysimeter) are plotted on the abscissa. The ideal fit was determined using the least square method, where the difference between the measured DLMO and the predicted DLMO was calculated.

