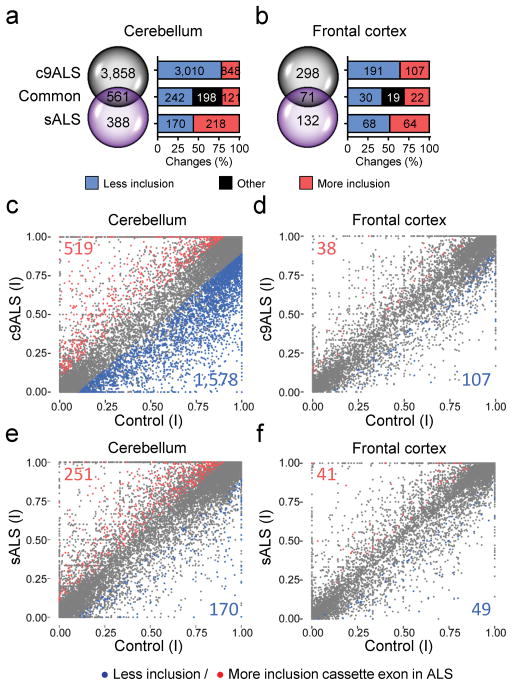
Figure 4.
Extensive misregulation of cassette exon splicing occurs in the c9ALS cerebellum. (a, b) Venn diagrams showing the number of unique and common AS cassette exon events in c9ALS and sALS cerebellum (a) and frontal cortex (b) (FDR < 0.05). (c–f) Scatter plots showing exclusion (blue) and inclusion (red) of AS cassette exons in c9ALS (c,d) and sALS (e,f) in comparison to controls (FDR < 0.05, |dI| ≥ 0.1) in cerebellum (c,e) or frontal cortex (d,f). dl: differential index value. Exon inclusion indices (I) are plotted for control group (x-axis) vs. c9ALS (c,d, y-axis) or vs. sALS (e,f, y-axis).

