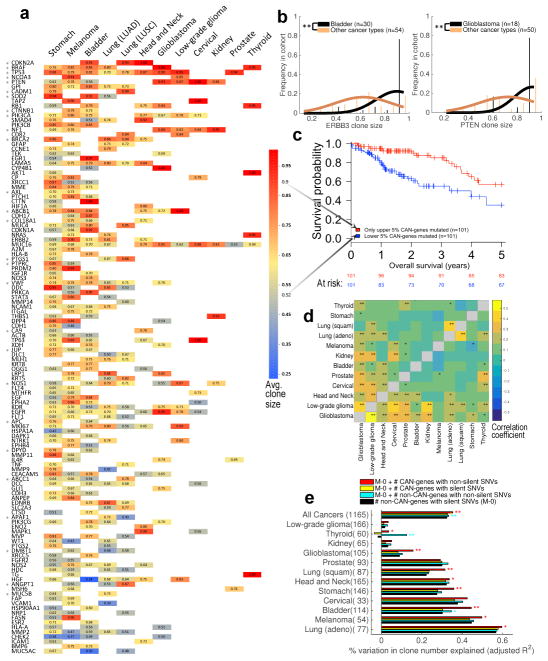
Figure 3. Association of driver gene mutations to clone size and clone number.
(a) Clone sizes were predicted by EXPANDS for mutations in 124 CAN-genes and normalized by purity. For each cancer type CAN (x-axis) and gene G (y-axis), average clone size was calculated across all CAN clones that harbor non-silent SNVs in G. Blank entries denote that G was not significantly associated to CAN. SNVs in CAN-genes often have the tendency to occur in clones of characteristic sizes, independent of cancer type (one-sided t-test: *P<0.05). (b) Mutations in some CAN-genes tend to drive large clonal expansions in certain cancer types, for example ERBB3 mutations in bladder carinoma and PTEN mutations in Glioblastoma (one-sided t-test: **P<1E–4). (c) SNVs in CAN-genes that characteristically grew to smaller clones predicts poor prognosis across tumor types (Log-rank test: P=2.9E–4; HR=2.72). (d) Clones with CAN-gene mutations have similar sizes across certain tumor types, suggesting the order/selective advantage of CAN-gene mutations is often not tissue-specific. Pairwise similarity between tumor types is calculated as Spearman correlation (**P<0.01; *P<0.05) based on EXPANDS (above diagonal) and PyClone results (below diagonal). (e) The number of clones identified in a sample depends on SNV incidence, but not all SNV categories are equally associated with the resulting number of clones. Non-silent SNV incidence in CAN-genes (red; mean = 2 genes) explain variability in clone number better than silent SNV incidence in CAN-genes (yellow; mean = 1 gene) or non-silent SNV incidence in non-CAN-genes (cyan; mean =128 genes). Log-likelihood test: **P<0.01; *P<0.05.

