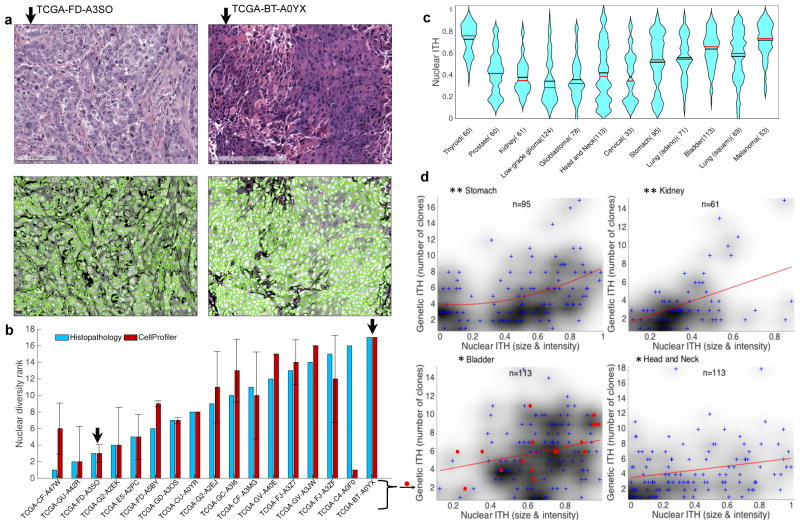
Figure 4. Intra-tumor nuclear diversity accompanies intra-tumor genetic diversity.
(a) Quantitation of intra-tumoral nuclear diversity from H&E images. Conventional H&E stainings (upper panels) of two bladder cancer specimens are shown. The lesion on the left (TCGA-GD- A3SO) demonstrates monomorphic high-grade nuclei with open chromatin and prominent nucleoli, while the lesion on the right (TCGA-BT-A0YX) demonstrates nuclei that vary from small with condensed chromatin to very large with open chromatin (anisochromasia). CellProfiler outlines nuclei (lower panels) and quantifies nuclear variability from the H&E images. (b) Quantitation of nuclear diversity is shown for the two bladder cancer specimens in panel a (black arrows) along with 15 other bladder cancer specimens. Independent ranking of intra-tumor nuclear diversity across these 17 bladder cancer specimens by an expert histopathologist (blue) validates the automated nuclear diversity measures (red) (ρ=0.64; P=0.007). (c) Violin plots of nuclear diversity within tumor types. Nuclear diversity was normalized to account for differences in tumor purity. Tumor types are ordered according to their extent of genetic ITH (Fig. 2b). (d) Nuclear diversity per tumor (x-axis; quantified based on nuclear intensity and size diversity) increases with increasing clone number per tumor (y-axis). This is true for all cancers combined (ρ=0.243; P=6.30E–14) as well as for the specific types shown (* ρ>0.25; P<0.01; ** ρ>0.4; P<0.001). The p-values shown here have not been corrected for multiple hypothesis testing.

