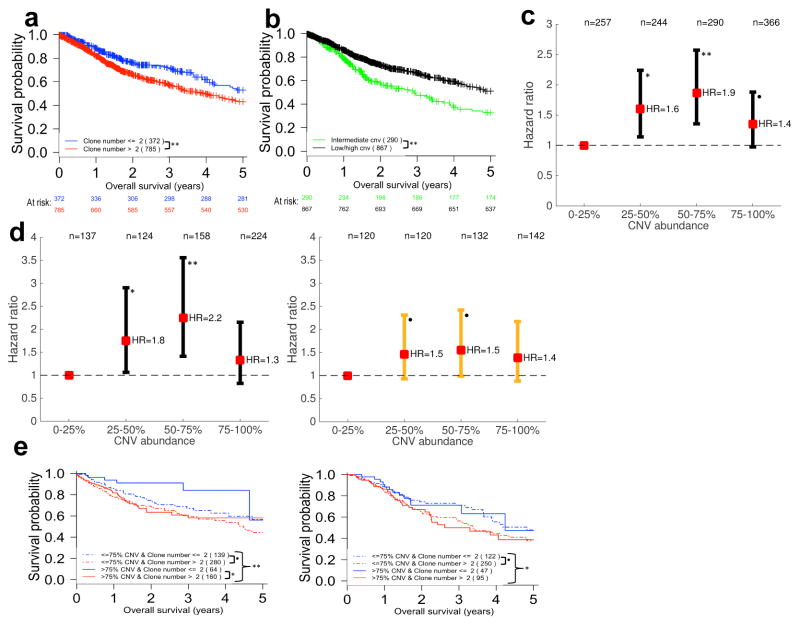
Figure 5. Clone number and CNV burden appear to be universal prognostic biomarkers.
(a) The presence of more than two clones detected by EXPANDS in a tumor sample predicts poor overall survival across all 12 tumor types (HR=1.497). (b) Survival curves are stratified by the fraction of the tumor-metagenome affected by CNVs (CNV abundance) across 12 tumor types. Intermediate levels of CNV abundance predict poor outcome (HR=0.597). (c) Hazard ratios as a function of CNV abundance. The hazard ratio for each of the upper three CNV abundance quartiles is calculated relative to the hazard of individuals in the lowest quartile (0–25% CNV abundance) and displayed along with 95% confidence interval. (d) Individuals treated with chemo- or radiotherapy (right panel) and untreated individuals (left panel) are stratified by CNV abundance. Individuals with low (<25%) or high CNV abundance (>75%) progress more slowly than individuals with intermediate CNV abundance levels (25–75%), especially within the group that did not receive adjuvant chemo- or radiotherapy. (e) Untreated individuals (left panel) with few clones in their tumors (blue lines) survive longer than untreated individuals with a large number of clones detected in their tumors (red lines), especially when these few clones share a large CNV burden (blue continuous line). This is not the case for treated individuals (right panel). All hazard ratios were calculated with log-rank tests (** P<0.005; * P<0.05; • P<0.1). For each stratum in panels (a,b,e) at least 50% of the 12 analyzed tumor types were represented at >5% frequency.

