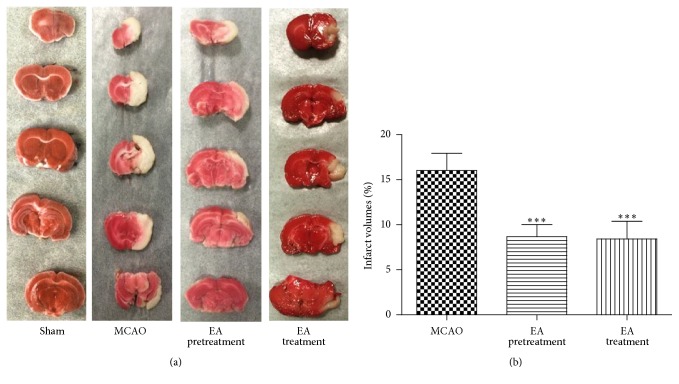
Figure 2.
Observation of infarction volume: (a) the representative 2,3,5-triphenyltetrazolium chloride (TTC) staining (n = 6 animals per group), ischemic area being white and intact area stained red. (b) Percentage of infarct volume of the cerebral infarct in the rat brain (n = 6 animals per group). Brain tissues displayed obvious infarction in MCAO group compared to Sham-operated group. Both EA pretreatment and EA treatment groups showed a tendency of decrease in infarction volume compared to MCAO group. Results are expressed as mean ± SEM. ∗∗∗ P < 0.001 versus MCAO.

