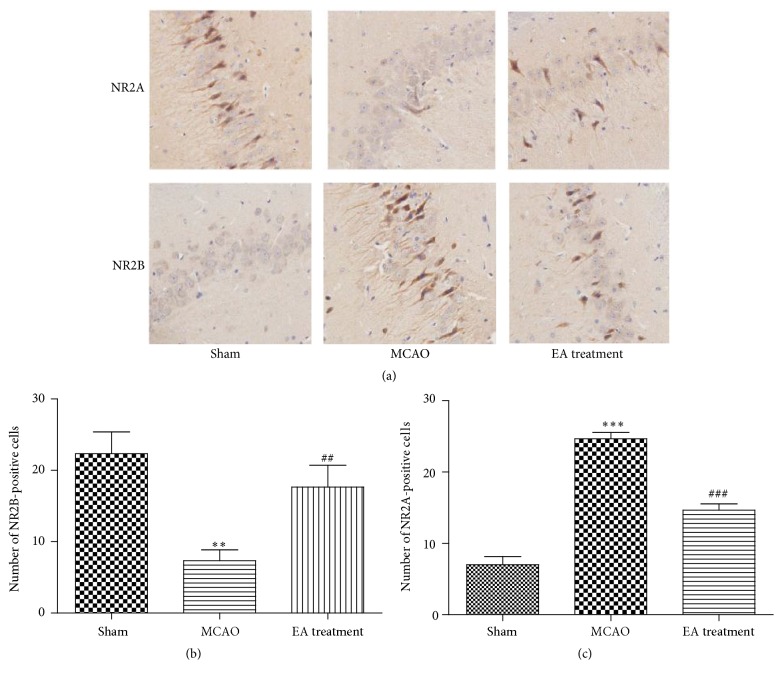
Figure 8.
Effects of EA on expression of NR2A and NR2B after MCAO. (a–c) Immunohistochemistry staining for NR2A- and NR2B-positive cells in hippocampal CA1 region in different groups (×400) (n = 6 animals per group). Data represent mean ± SEM. ∗∗ P < 0.01 and ∗∗∗ P < 0.001 versus Sham and ## P < 0.01 and ### P < 0.001 versus MCAO.

