
Figure 1.
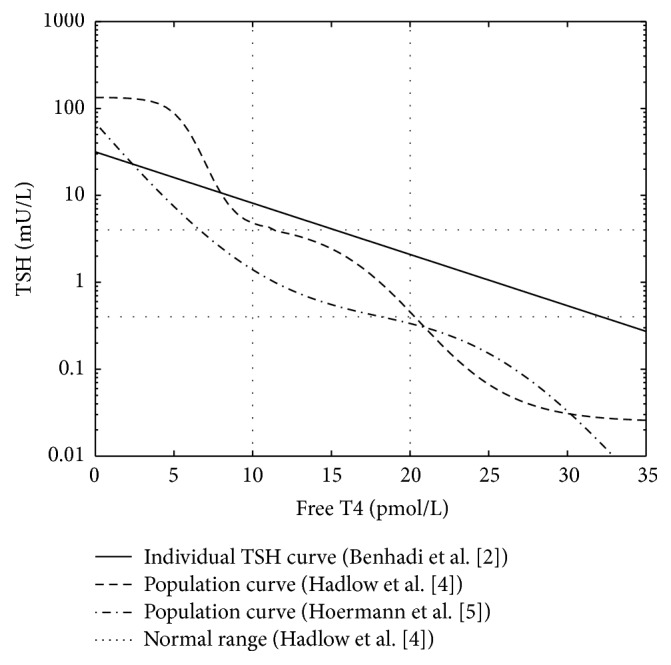
Comparison of 2 representations of the population distribution of T4/TSH (the population curve) with the T4/TSH physiological relationship as described in individuals (the TSH curve).
Official websites use .gov
A
.gov website belongs to an official
government organization in the United States.
Secure .gov websites use HTTPS
A lock (
) or https:// means you've safely
connected to the .gov website. Share sensitive
information only on official, secure websites.
Comparison of 2 representations of the population distribution of T4/TSH (the population curve) with the T4/TSH physiological relationship as described in individuals (the TSH curve).