
Figure 2.
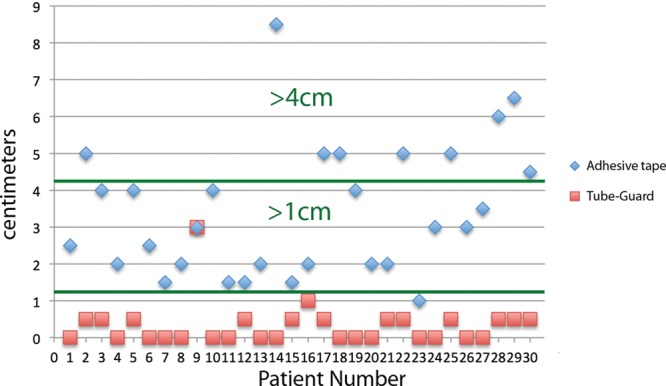
Results summary. This graph highlights the study results. Every patient is represented by a number and plotted on the x-axis. Endotracheal tube (ETT) movement during applied traction is plotted for each patient on the y-axis in centimeters. Movement distance is denoted by blue diamonds during fixation with adhesive tape and red squares during fixation with the Haider Tube-Guard. Individual patients have both symbols shown because each patient served as his or her own control. Horizontal green lines highlight 2 clinically relevant categories: (1) >1-cm ETT movement and (2) >4 cm of ETT movement.