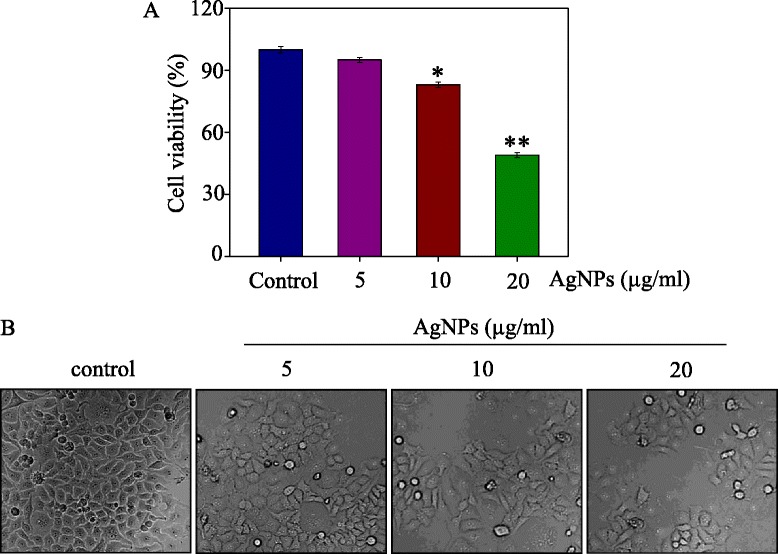
Fig. 3.

Growth inhibition AgNPs on HePG-2 Cells. a Cell viability were treated with different concentrations of AgNPs for 72 h and measured by MTT assay. b Morphological changes in HePG-2 cells. Bars with different characters are statistically different at P < 0.05(*) or P < 0.01(**)
