
Fig. 4.
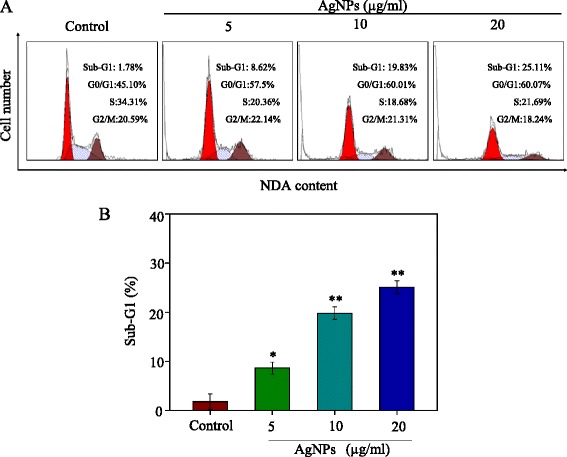
Flow cytometric analysis of HePG-2 cells after treated with AgNPs for 72 h stained with PI after fixation by 70 % ethanol. As shown in a and b, the cell cycle distribution after different treatments and apoptotic cell population was determined by PI flow cytometric analysis. Bars with different characters are statistically different at P < 0.05(*) or P < 0.01(**)