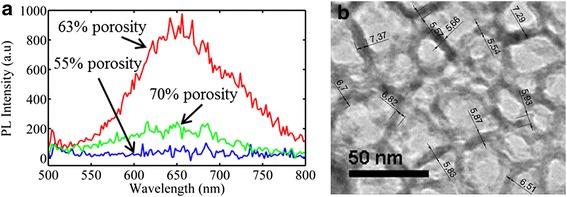
Fig. 7.

a PL spectra of porous Si membranes with different porosities. The sample with the highest porosity (green line) was fabricated using different electrolyte compositions (40 % HF concentration). b TEM image of the 70 % porosity sample. From the TEM image, the average pore wall thickness was calculated to be ~6 nm
