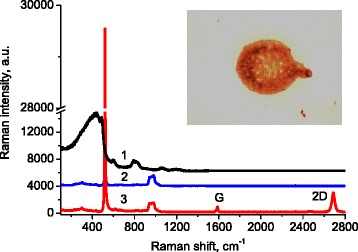
Fig. 1.

The Raman spectra of silica (1), silicon (2), and graphene on silicon (3). Spectra are not normalized but only shifted along the vertical axis for clarity. Inset: microscopic image of a dried micro-droplet of adenine solution deposited on the graphene surface
