
Fig. 3.
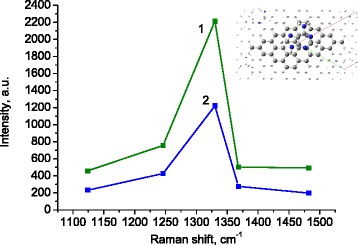
The intensities of the adenine Raman bands in the range 1100–1500 cm−1 at the cases of 514-nm (1) and 488-nm (2) excitations. Intensities are background corrected and normalized to incident laser power. Inset: schematic arrangement of adenine molecule on the graphene surface. Nitrogen atoms are marked by a blue color