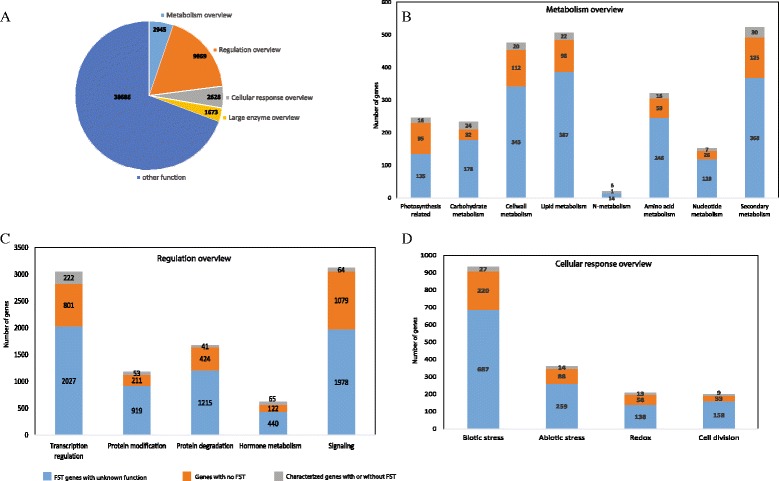
Fig 2.

MapMan classification of all RGAP annotated genes, FST genes, and non-FST genes. a Proportion of FST genes mapped to four main MapMan overviews and others. Genes allotted to various sub-functional classes of main overviews for b metabolism overview, c Regulation overview, and d Cellular response overview. Each distribution bar indicates the proportion of characterized genes, FST and non-FST genes with color codes
