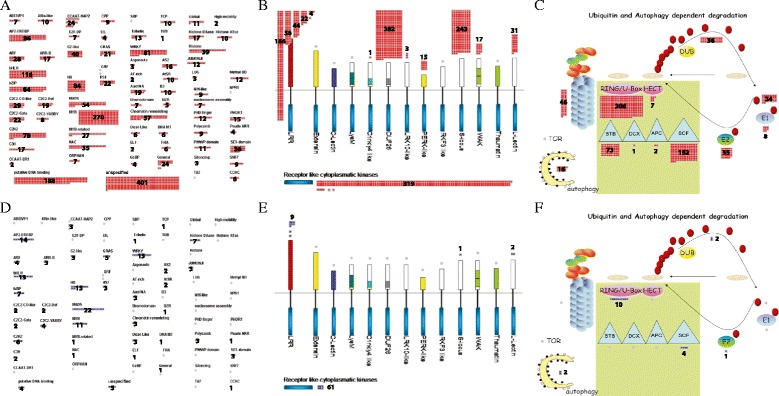
Fig 4.

MapMan analysis of FST genes and characterized genes in transcription, kinases, and ubiquitin and autophagy dependent protein degradation overviews. transcription (a, d), kinases (b, e), and ubiquitin and autophagy dependent protein degradation (c, f) overview diagrams associated with FST genes (red boxes) and characterized genes (blue boxes). Numeric numbers indicates the number of FST genes or characterized genes mapped to sub-functional classes in each overview
