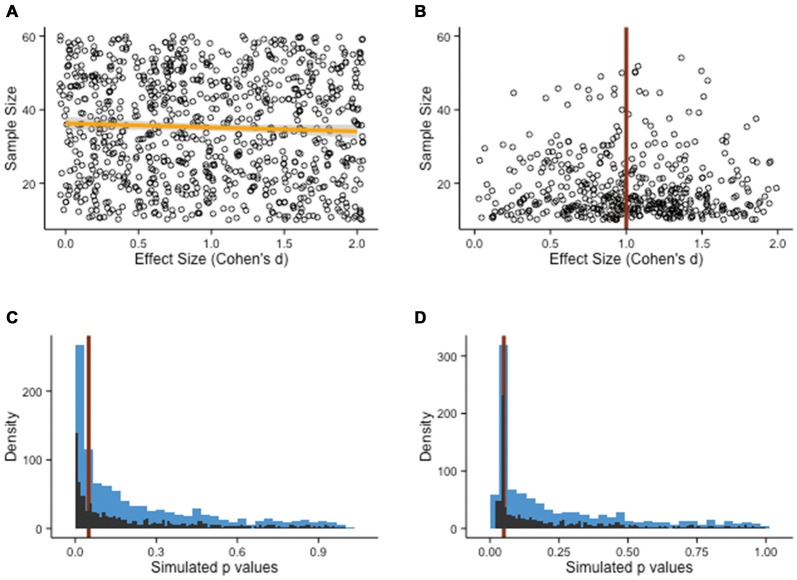
Figure 7.
Publication bias. (A) Population of study outcomes, with effect sizes and associated sample sizes. There is no correlation between the two variables, as shown by the slope of the fit line (orange line). (B) It is often assumed that in the absence of publication bias, the population of studies should roughly resemble the shape of a funnel, with small sample studies showing important variation and large sample studies clustered around the true effect size (in the example, d = 1). (C) Alternatives have been proposed (see main text), such as the p-curve. Here, a Monte Carlo simulation of two-sample t-tests with 1000 draws (N = 20 per groups, d = 0.5, M = 100, SD = 20) shows a shape resembling a power-law distribution, with no particular change around the p = .05 threshold (red line). The blue bars represent the rough density histogram, while the black bars are more precise estimates. (D) When the pool of published studies is biased, a sudden peak can sometimes be observed just below the p = .05 threshold (red line). Arguably, this irregularity in the distribution of p-values has no particular justification, if not for bias.

