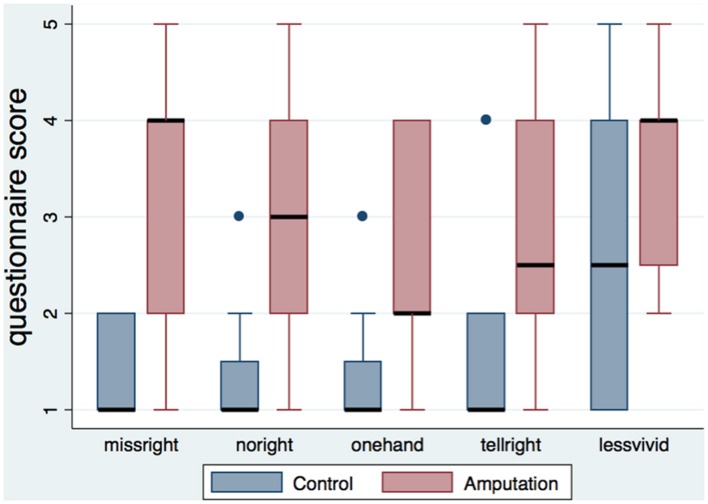
FIGURE 2.
Boxplot of the amputation related statements per condition. The height of the boxes represents the interquartile ranges, the black lines represent the medians and the blue dots represent the outliers. Participants in the amputation condition rated the statements related to the illusion of amputation significantly higher than the control group.

