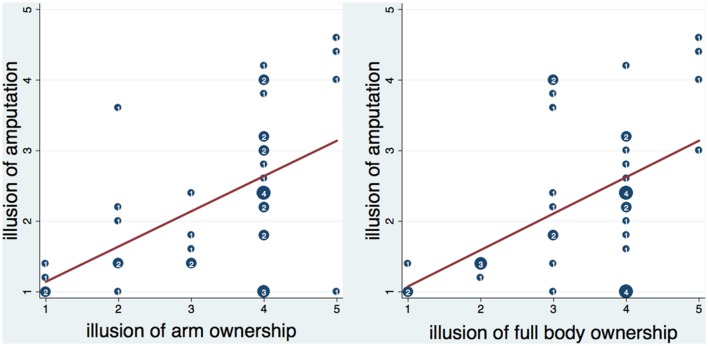
FIGURE 3.
Scatterplot of the amputation illusion with arm and full body ownership illusion. Numbers inside circles indicate the number of overlapping points and the red lines represent the fitted regression lines. The amputation illusion was significantly correlated with arm and full body ownership illusion (see text). Moreover, it was significantly predicted by arm ownership (b = 0.49, t = 3.86, p < 0.001) and full body ownership (b = 0.52, t = 3.52, p = 0.001) respectively. Both arm and full body ownership explained a significant proportion of variance in the amputation illusion [arm ownership – R2 = 0.26, F(1,38) = 14.86, p < 0.001; full body ownership- R2 = 0.23, F(1,38) = 12.42, p < 0.01].

