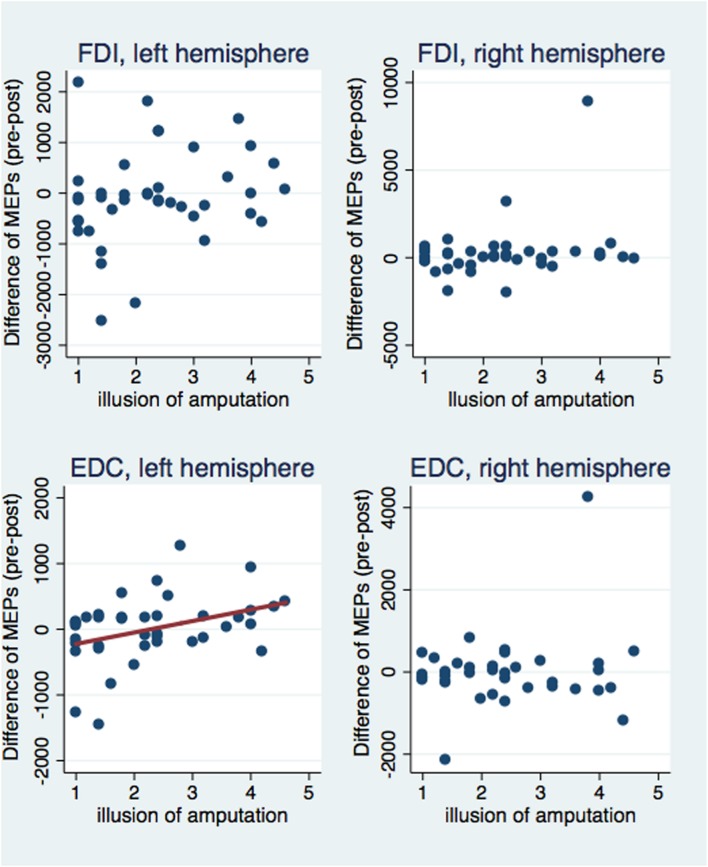
FIGURE 5.
Scatterplot of the difference between pre and post-VR MEP amplitudes with the illusion of amputation per each muscle and hemisphere. The difference in amplitudes was significantly correlated with the amputation illusion only for the EDC muscle of the left hemisphere (see text). Similarly, only in this case, the amputation illusion predicted significantly the MEPs’ difference (b = 174.33, t = 2.53, p = 0.016) and explained a significant proportion of its variance [R2 = 0.12, F(1,37) = 6.39, p = 0.016].

